A client asked me last month what their AI traffic number "should" be. Fair question. They'd read somewhere that it was about 1%, theirs was nowhere near that, and they wanted to know how worried to be.
I went looking for the source of the 1%. Then I went looking for the source of the source. Two hours later I had four different numbers from four studies, a publication date that turned out to be wrong, and a much better answer to the original question.
It's the same shape as asking what SEO costs. A perfectly reasonable question where the honest answer is that the number depends on things nobody put in the headline.
The answer is that the number they'd read was real, correctly reported, and almost useless for their situation. Not because anyone lied. Because "what percentage of traffic comes from AI search" turns out to be a question with at least four moving parts, and most of the places quoting a figure have flattened all four into one confident-sounding decimal.
What counts as AI referral traffic?
Worth separating three things that get used interchangeably and shouldn't be, because a lot of the confusion downstream starts here.
AI referral traffic is a person clicking a link inside an AI answer and landing on your site. It's a session. It shows up in analytics, at least in theory. This is the thing all the percentages in this post are measuring.
AI citations are your page being used as a source in an answer, whether or not anyone clicks. You can be cited constantly and get almost no referrals from it. That's a different metric answering a different question, and it has its own shelf-life problem worth understanding separately.
Brand mentions are the AI describing your business in prose without linking to you at all. No click, no citation, still commercial impact.
One more that gets mixed in by accident: AI crawler traffic is bots hitting your server to read your pages. That's a cost and an access question, not an audience one, and it moves independently of everything above. Worth keeping in a separate column.
Three metrics, three questions. If you're trying to work out whether your GEO work is paying off, referral traffic is the narrowest of the three and, as it turns out, the one your analytics is worst at counting.
So what do the numbers actually say?
Here's every first-party measurement I could verify, with the sample and window attached, because a percentage without those two things isn't a fact. It's a rumor with a decimal point.
| Source | Share of traffic | Sample | Measured |
|---|---|---|---|
| Contentsquare | 0.2% of total visits Services 0.5%, Software 0.3% |
99 billion sessions, 6,500 sites, cross-industry | Full-year 2025 Published April 2026 |
| SE Ranking | 0.32% of all website traffic 0.24% in 2025, 0.02% in 2024 |
Global, across seven AI platforms | Through 2026 Published June 2026 |
| Conductor | 1.08% across ten industries Range: 0.25% to 2.80% |
1,215 of its own enterprise customer domains | U.S., May to Sept 2025 Published November 2025 |
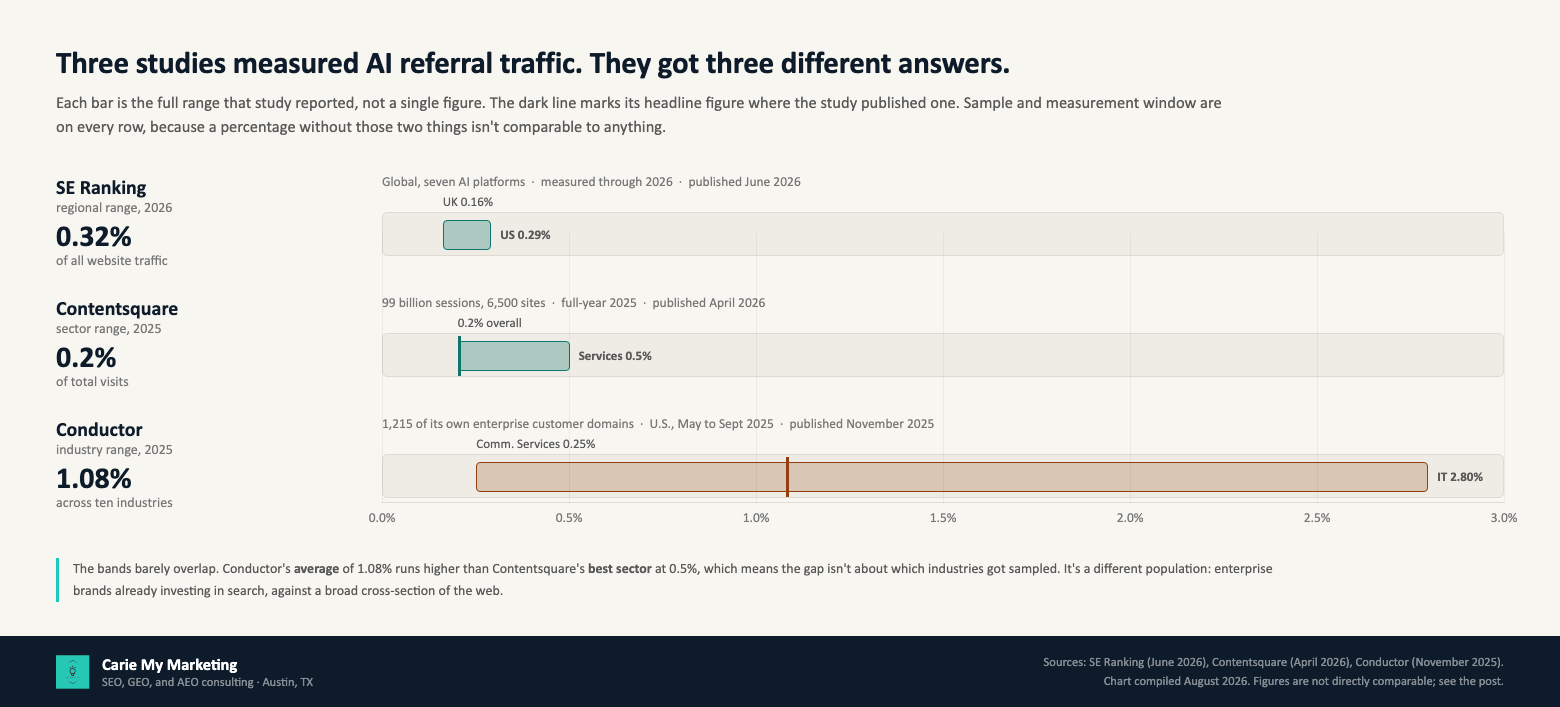
Read down the "Measured" column before you read the percentages. The Conductor figure that gets quoted most often is the oldest one in the table, drawn from the narrowest and least representative sample. That isn't a criticism of Conductor, which documented its methodology clearly. It's a criticism of how the figure travels once it leaves the report.
Why the studies disagree
The obvious explanation is that Conductor happened to sample AI-heavy industries. It's a reasonable guess and it's wrong, and the way you can tell is worth sitting with for a second.
Conductor's overall average of 1.08%, on data from May to September 2025, is more than double Contentsquare's single best-performing sector across full-year 2025, which was Services at 0.5%.
If the difference were just about which industries landed in the sample, the two ranges would overlap in the middle. Conductor's low sectors would sit inside Contentsquare's range and its high sectors would poke out the top. That isn't what happened. Conductor's entire distribution sits above Contentsquare's, floor almost to ceiling. That's not a sampling quirk. That's a different population, measured end to end.
Which makes sense once you say out loud who's in each sample. Conductor measured 1,215 of its own enterprise customers, companies that had already bought enterprise search software and were presumably using it. Contentsquare measured a broad cross-section of 6,500 sites, most of which are doing whatever normal companies do. Those two groups were never going to produce the same number, and neither one is "the web."
So the useful question isn't which study is right. It's which population you resemble. If you're an enterprise brand with a search team, the higher end is probably closer to your reality. If you're a regional B2B company with a good site and no dedicated search budget, it isn't.
The number moves inside a single study too
This is the part that convinced me no benchmark is coming.
Take Conductor's own data, the May to September 2025 window. One study, one method, one stretch of time, and inside it the range ran from 0.25% in Communication Services to 2.80% in IT. That's an eleven-fold spread without changing anything about how the measurement was done. Conductor's floor is close to Contentsquare's entire average.
Then take SE Ranking's, which is the only one of the three with a real trend line. Their series peaks in October 2025 at 0.3511%, dips over the holidays, and starts recovering in early 2026. Same sample, same method, and the answer you get depends on which month you looked.
Their regional cut does the same thing: 0.29% in the US, 0.27% in the EU, 0.16% in the UK for 2026. One study, three answers, all correct.
So before you compare yourself to anyone, understand that "the number" already varies by industry, by month, and by country inside a single dataset. A benchmark that ignores all three isn't a benchmark. It's an average of things that shouldn't be averaged.
And the platforms are reshuffling underneath it
While the level is moving, the mix is moving faster.
Conductor put ChatGPT at 87.4% of AI referral traffic on its May to September 2025 data. SE Ranking put it at 74.78% for 2026. And Similarweb tracked ChatGPT's share of worldwide generative AI web traffic falling from roughly 76% in June 2025 to about 53% by May 2026, with Gemini climbing from under 9% to somewhere around 27%.
One important caveat, and I'd rather flag it than quietly let it slide past. The Similarweb figure measures share of traffic to AI platforms, not share of referrals from them. It's a different metric and the numbers are not interchangeable with the other two. Treat it as direction, not as a fourth data point in the same series. Conflating those two things would be exactly the error this post is about.
But the direction is consistent across all three, measured three different ways: ChatGPT's dominance is real and it's eroding. Which matters practically, because a strategy built on one platform is a strategy with a shelf life, and the numbers say that shelf life is measured in quarters.
Some of your AI traffic isn't labeled AI traffic
Everything above is measuring what analytics can see. There's a gap between that and what actually happened, and it runs in one direction.
When somebody opens a link inside an AI platform's mobile app, the in-app browser frequently doesn't pass a referrer. When somebody copies a URL out of an answer and pastes it into a fresh tab, there's no referrer to pass. Privacy-focused browsers and referrer policies strip it too. In every one of those cases your analytics sees a visitor arriving from nowhere and files it under Direct.
This has been measured directly. Alex Galinos tracked 51,200 AI Overview click events for a single brand from September 2025 to June 2026 and published the results in Search Engine Land, and 22.4% of them landed in Direct instead of Organic, swinging from 16.8% in April 2026 to 29.3% in May. One brand, so it's a number to check your own data against rather than a law of the web, and the full breakdown lives in the AI Overviews post.
Two consequences worth holding onto. Every percentage in the table above is a floor, not a measurement. And the gap is probably widening, because usage keeps shifting toward native apps, which are the worst offenders for referrer loss.
Which is why the numbers you're quoted are older than they look
I ran a check while writing this. On August 26, 2026, I pulled the pages ranking for this question and read what they actually said.
Three of the top eight quoted ChatGPT at 87.4% of AI referral traffic as a current fact. Two of them stamped it "2026." That figure was measured between May and September 2025. One listed it under "key takeaways" next to an AI Overview trigger rate from the same 2025 report, introduced with the words "they now appear in."
Meanwhile the two freshest first-party measurements available that same day put ChatGPT at 74.78% and, on the platform-traffic metric, around 53%.
I'm not naming them, because the point isn't that those particular pages are bad. The point is structural. Most "AI search statistics" pages are aggregations, and aggregations copy each other. A number gets published, gets picked up without its date, gets restated as current, and gets picked up again from the restatement. Nobody along that chain is lying. Nobody along that chain went back to the report either.
The gap between the 2025 figure and the 2026 one isn't academic. It's the difference between "optimize for one platform" and "you now have several." Someone planning against the older number is planning for a market that has already moved.
So what should you actually measure?
If there's no benchmark, the instinct is to give up on measuring and go by feel. That's the wrong lesson. There's plenty worth measuring. It's just not the thing everyone's asking for.
Your own direction, against your own baseline. The only comparison that means anything is you against you, last quarter. An external benchmark tells you how you stack up against a population you probably don't belong to. Your own trend line tells you whether the work is doing something.
Presence as a rate, not as a snapshot. Asking an AI system about your category once and screenshotting the answer tells you almost nothing, because the answers vary run to run. What matters is how often you show up across a set of prompts over a window. A single check is a coin flip you've mistaken for a measurement.
What the visitors do, not how many arrive. At these volumes the count is noisy and easy to over-read. Behavior is the more stable signal, and the early evidence says these visitors are different: Contentsquare reported AI-referred traffic converting at 1.3% in 2025, up from 0.8% in 2024. If AI is sending you people who already decided before they arrived, a small channel can matter more than its size suggests.
The gap itself. Any honest measurement setup has to account for the traffic it can't see, rather than quietly reporting the visible portion as if it were the total. That means knowing roughly how much of your Direct bucket is attributable, and treating your reported AI number as a floor in every conversation where it comes up.
And if the honest reading of your own data is that AI systems aren't surfacing you at all, that's a different problem with a different diagnostic. Checking whether you're invisible to AI search comes before measuring how much it sends you.
What all four have in common is that none of them requires a benchmark. They require a baseline, a window, and a consistent method, which is a different and much more achievable thing.
Getting that right is real work, and it's most of what an AI visibility engagement actually produces. Not a dashboard number to compare against the industry, but a measurement setup that survives referrer loss, platform churn, and seasonality, and still tells you whether the last quarter of effort moved anything. If your current reporting can't do that, the number it's showing you isn't wrong so much as unanswerable, which is the harder problem. It's the same discipline that separates knowing whether your SEO is working from watching a line move.
There is no reliable benchmark for what share of your traffic should come from AI search, and anyone quoting you one either hasn't checked the date on it or hasn't checked the sample.
As of August 2026 the published range is 0.2% to 1.08%, the studies disagree because they measured different populations, the figure moves by industry and month and country inside a single dataset, the platform mix is reshuffling every quarter, and a meaningful slice of the traffic never gets labeled correctly in the first place.
Stop asking what your number should be. Start asking whether your own number is moving, whether the people behind it convert, and whether your measurement can see what it claims to see. Those questions have answers.
Frequently asked questions
Published estimates run from 0.2% to 1.08% of total visits, and the spread is mostly about who got measured. Contentsquare put it at 0.2% across 99 billion sessions and 6,500 sites for 2025. SE Ranking put it at 0.32% for 2026. Conductor put it at 1.08% across ten industries, measured on 1,215 of its own enterprise customer domains using U.S. data from May to September 2025. All three are probably floors, because a share of AI-referred traffic never gets labeled as AI traffic at all.
Because they measured different populations, not because one of them measured badly. The clearest evidence is that Conductor's overall average of 1.08%, measured May to September 2025, runs higher than Contentsquare's single best-performing sector across full-year 2025, which was Services at 0.5%. If the gap were just a matter of which industries got sampled, the two ranges would overlap. They barely do. Conductor sampled enterprise brands already investing heavily in search. Contentsquare sampled a broad cross-section of sites.
There is no normal to compare against, which is the honest answer. Inside Conductor's single study of 1,215 enterprise domains, measured May to September 2025, the range ran from 0.25% in Communication Services to 2.80% in IT, an eleven-fold spread within one dataset. Your own figure depends on your industry, your business model, your audience's device habits, and how much of the traffic your analytics can actually see. A number that is high for one business is low for another.
Because the referrer gets lost in transit. When someone opens a link inside an AI platform's mobile app, copies a URL out of an answer and pastes it into a new tab, or arrives through a browser that strips referrer data, your analytics sees a visit with no source and files it under Direct. In a single-brand study by Alex Galinos, published by Search Engine Land, tracking 51,200 AI Overview click events from September 2025 to June 2026, 22.4% landed in Direct rather than Organic. That's one brand, not a universal rate, so treat it as a number to check your own analytics against.
ChatGPT still sends the most, but its lead is shrinking fast and any specific figure has a short shelf life. Conductor put ChatGPT at 87.4% of AI referral traffic on data from May to September 2025. SE Ranking put it at 74.78% for 2026. Similarweb, measuring a different thing entirely, saw ChatGPT's share of generative AI web traffic fall from roughly 76% in June 2025 to about 53% by May 2026. Those metrics are not directly comparable, but the direction is consistent.
The early evidence points that way, but it is a small channel being measured over short windows, so treat it as a signal rather than a settled fact. Contentsquare reported AI-referred traffic converting at 1.3% in 2025, up from 0.8% in 2024. The more useful question is not whether the channel converts better on average, but whether the AI-referred visitors reaching your own site behave differently from your other visitors.
Worry about whether you can be found and cited, not about the referral count. At these volumes, zero recorded AI referrals is a normal reading for a small site even when AI systems are surfacing you, partly because some of that traffic is being filed as Direct. The question worth answering is whether AI systems can crawl you, whether they describe your business correctly, and whether you appear when someone asks about your category.
Sources
- Contentsquare: 2026 Digital Experience Benchmark, AI-referred traffic, 99 billion sessions across 6,500 sites (April 2026; full-year 2025 data)
- SE Ranking: AI traffic grew 16x from 2024 to 2026, global study across seven AI platforms (June 2026)
- Conductor: 2026 AEO/GEO Benchmarks Report, 1,215 enterprise customer domains (published November 2025; U.S. traffic data May to September 2025)
- Similarweb: Generative AI platform traffic share, June 2025 to May 2026 (published July 2026, updated August 2026)
- Search Engine Land (Alex Galinos): I Tracked 51,000 AI Overview Events, Here's What the Data Shows (August 18, 2026) · single-brand case study